I have DSD+ data dumped into excel. I want to make a graph illustrating how busy the repeater is.
how do I do it?
| Attachments: |
|
radio usage.png [ 30.87 KiB | Viewed 2607 times ] |
| InterceptRadio.com Forums http://www.interceptradio.com/bbs/ |
|
| Graphing radio usage http://www.interceptradio.com/bbs/viewtopic.php?f=20&t=8770 |
Page 1 of 1 |
| Author: | gregz [ Sun Apr 09, 2017 11:35 am ] | ||
| Post subject: | Graphing radio usage | ||
I have DSD+ data dumped into excel. I want to make a graph illustrating how busy the repeater is. how do I do it?
|
|||
| Author: | nickcarr [ Sun Apr 09, 2017 5:38 pm ] |
| Post subject: | Re: Graphing radio usage |
Nice try, but the data you suggest is nothing related to a system's capacity -- only that this channel was active at X:XX time. You'd need to dump the CC log into a text file and parse any relevant data. Then you'd have to find data that would prove your "system capacity usage" theory -- so the on/off time of each voice channel -- and then map the times that those channels are active. It's not impossible but it's a lot more complex than you think. Also, I'm not even sure if DSD provides a "TIME OFF" value. |
|
| Author: | nickcarr [ Sun Apr 09, 2017 5:44 pm ] |
| Post subject: | Re: Graphing radio usage |
The data you suggest could be used to "imply" that X channel most active at X:XX time of day (in a 24 hour period) -- however, it's not capacity or time usage -- it'd be more like "channel hits" at X:XX time of day. I guess that would indirectly imply that there's voice activity on X channel. So instead of a graph, you'd be looking more at a "heat map" kind of layout. (Except that the red color would indicate the most traffic...) Something like this: 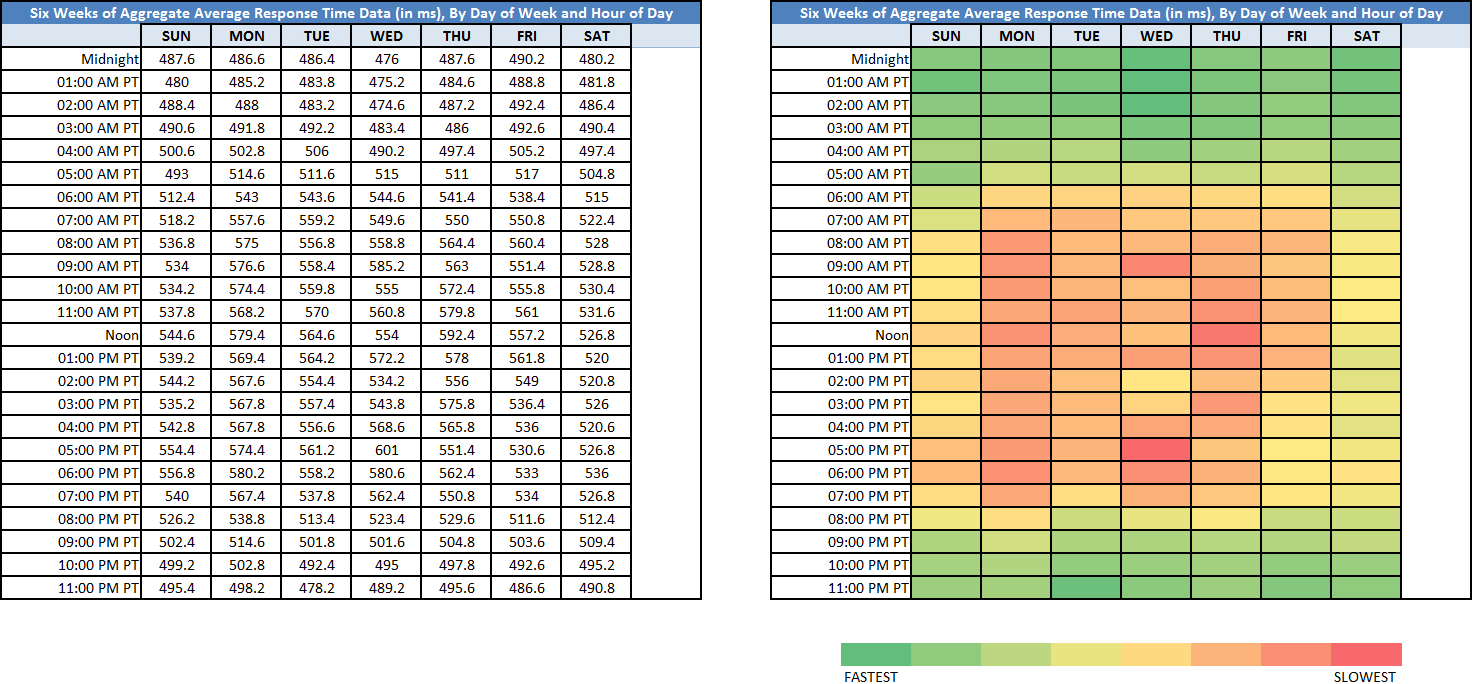 The data values on the left would represent "hits per hour" on X voice channel... but you'd have to do it for each voice channel. This is where it gets more complex... ;o) |
|
| Author: | gregz [ Fri May 12, 2017 1:29 pm ] |
| Post subject: | Re: Graphing radio usage |
Solved. I figured it out. Convert the time to an integer INT Use a pivot table to Count vs Integer. Than just graph what the pivot table spat out this video helped a ton https://www.youtube.com/watch?v=BvUwyP6oUYg Attachment: radio use.JPG [ 67.64 KiB | Viewed 2482 times ] |
|
| Author: | nickcarr [ Fri May 12, 2017 3:21 pm ] |
| Post subject: | Re: Graphing radio usage |
What exactly are you using for your Y data? |
|
| Author: | gregz [ Sun May 14, 2017 1:39 pm ] |
| Post subject: | Re: Graphing radio usage |
DSD+ spits out a "DSDPlus.srt" file it contains an entry for every second the repeater is lit up: 22003 06:06:42,000 --> 06:06:43,000 2017/03/22 07:24:00 -DMR CC=11 Slot 1 --- 22004 06:06:43,000 --> 06:06:44,000 2017/03/22 07:24:00 -DMR CC=11 Slot 1 --- 22005 06:06:44,000 --> 06:06:45,000 2017/03/22 07:24:01 -DMR CC=11 Slot 1 --- 22006 06:06:45,000 --> 06:06:46,000 2017/03/22 07:24:02 -DMR CC=11 Slot 1 --- 22007 06:06:46,000 --> 06:06:47,000 2017/03/22 07:24:03 -DMR CC=11 Slot 1 --- |
|
| Page 1 of 1 | All times are UTC - 8 hours |
| Copyright © 2013 Interceptradio.com |
|